@author: Datriks
import numpy as np
import matplotlib.pyplot as plt
import warnings
warnings.simplefilter('ignore')
plt.rcParams['figure.figsize'] = 10,4
#Seasons
Seasons = ["2005","2006","2007","2008","2009","2010","2011","2012","2013","2014"]
Sdir = {"2005":0,"2006":1,"2007":2,"2008":3,"2009":4,"2010":5,"2011":6,"2012":7,"2013":8,"2014":9}
#Players
Players = ["KobeBryant","JoeJohnson","LeBronJames","CarmeloAnthony","DwightHoward","ChrisBosh","ChrisPaul","KevinDurant","DerrickRose","DwayneWade"]
Pdir = {"KobeBryant":0,"JoeJohnson":1,"LeBronJames":2,"CarmeloAnthony":3,"DwightHoward":4,"ChrisBosh":5,"ChrisPaul":6,"KevinDurant":7,"DerrickRose":8,"DwayneWade":9}
#Free Throws
KobeBryant_FT = [696,667,623,483,439,483,381,525,18,196]
JoeJohnson_FT = [261,235,316,299,220,195,158,132,159,141]
LeBronJames_FT = [601,489,549,594,593,503,387,403,439,375]
CarmeloAnthony_FT = [573,459,464,371,508,507,295,425,459,189]
DwightHoward_FT = [356,390,529,504,483,546,281,355,349,143]
ChrisBosh_FT = [474,463,472,504,470,384,229,241,223,179]
ChrisPaul_FT = [394,292,332,455,161,337,260,286,295,289]
KevinDurant_FT = [209,209,391,452,756,594,431,679,703,146]
DerrickRose_FT = [146,146,146,197,259,476,194,0,27,152]
DwayneWade_FT = [629,432,354,590,534,494,235,308,189,284]
#creating the matrix
FreeThrows = np.array([KobeBryant_FT,JoeJohnson_FT,LeBronJames_FT,CarmeloAnthony_FT,DwightHoward_FT,ChrisBosh_FT,ChrisPaul_FT,KevinDurant_FT,DerrickRose_FT,DwayneWade_FT ])
#Remove the vectors we do not need them after creating the matrix
del(KobeBryant_FT,JoeJohnson_FT,LeBronJames_FT,CarmeloAnthony_FT,DwightHoward_FT,ChrisBosh_FT,ChrisPaul_FT,KevinDurant_FT,DerrickRose_FT,DwayneWade_FT)
#Free Throw Attempts
KobeBryant_FTA = [819,768,742,564,541,583,451,626,21,241]
JoeJohnson_FTA = [330,314,379,362,269,243,186,161,195,176]
LeBronJames_FTA = [814,701,771,762,773,663,502,535,585,528]
CarmeloAnthony_FTA = [709,568,590,468,612,605,367,512,541,237]
DwightHoward_FTA = [598,666,897,849,816,916,572,721,638,271]
ChrisBosh_FTA = [581,590,559,617,590,471,279,302,272,232]
ChrisPaul_FTA = [465,357,390,524,190,384,302,323,345,321]
KevinDurant_FTA = [256,256,448,524,840,675,501,750,805,171]
DerrickRose_FTA = [205,205,205,250,338,555,239,0,32,187]
DwayneWade_FTA = [803,535,467,771,702,652,297,425,258,370]
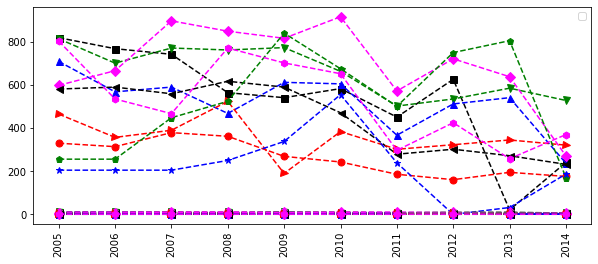
FreeThrowAttempts = np.array([KobeBryant_FTA,JoeJohnson_FTA,LeBronJames_FTA,CarmeloAnthony_FTA,DwightHoward_FTA,ChrisBosh_FTA,ChrisPaul_FTA,KevinDurant_FTA,DerrickRose_FTA,DwayneWade_FTA])
del(KobeBryant_FTA,JoeJohnson_FTA,LeBronJames_FTA,CarmeloAnthony_FTA,DwightHoward_FTA,ChrisBosh_FTA,ChrisPaul_FTA,KevinDurant_FTA,DerrickRose_FTA,DwayneWade_FTA)
#%%
# verify the matrices
print(FreeThrows)
print(FreeThrowAttempts)
#%%
def myplot1(data,mylist1 = Players):
Col_1 = {"KobeBryant":'black',"JoeJohnson":'red',"LeBronJames":'green',"CarmeloAnthony":'blue',"DwightHoward":'magenta',"ChrisBosh":'black',"ChrisPaul":'red',"KevinDurant":'green',"DerrickRose":'blue',"DwayneWade":'magenta'}
Mark1 = {"KobeBryant":'s',"JoeJohnson":'o',"LeBronJames":'v',"CarmeloAnthony":'^',"DwightHoward":'D',"ChrisBosh":'<',"ChrisPaul":'>',"KevinDurant":'p',"DerrickRose":'*',"DwayneWade":'h'}
for name1 in mylist1:
plt.plot(data[Pdir[name1]],c=Col_1[name1],ls='--',marker=Mark1[name1],ms=7,label = name1)
plt.xticks(list(range(0,10)),Seasons,rotation='vertical')
plt.legend(loc='upper right', bbox_to_anchor=(1, 1))
#visualise the new matrice
myplot1(FreeThrowAttempts)
#%%
#Games -import teh Games dataset
KobeBryant_G = [80,77,82,82,73,82,58,78,6,35]
JoeJohnson_G = [82,57,82,79,76,72,60,72,79,80]
LeBronJames_G = [79,78,75,81,76,79,62,76,77,69]
CarmeloAnthony_G = [80,65,77,66,69,77,55,67,77,40]
DwightHoward_G = [82,82,82,79,82,78,54,76,71,41]
ChrisBosh_G = [70,69,67,77,70,77,57,74,79,44]
ChrisPaul_G = [78,64,80,78,45,80,60,70,62,82]
KevinDurant_G = [35,35,80,74,82,78,66,81,81,27]
DerrickRose_G = [40,40,40,81,78,81,39,0,10,51]
DwayneWade_G = [75,51,51,79,77,76,49,69,54,62]
#Matrix
Games = np.array([KobeBryant_G, JoeJohnson_G, LeBronJames_G, CarmeloAnthony_G, DwightHoward_G, ChrisBosh_G, ChrisPaul_G, KevinDurant_G, DerrickRose_G, DwayneWade_G])
del(KobeBryant_G, JoeJohnson_G, LeBronJames_G, CarmeloAnthony_G, DwightHoward_G, ChrisBosh_G, ChrisPaul_G, KevinDurant_G, DerrickRose_G, DwayneWade_G)
#%%
#Plot the ratio of FreeThrowAttempts to Games
myplot1(FreeThrowAttempts/Games)
#%%
myplot1(FreeThrows/FreeThrowAttempts)
#%%
#Points
KobeBryant_PTS = [2832,2430,2323,2201,1970,2078,1616,2133,83,782]
JoeJohnson_PTS = [1653,1426,1779,1688,1619,1312,1129,1170,1245,1154]
LeBronJames_PTS = [2478,2132,2250,2304,2258,2111,1683,2036,2089,1743]
CarmeloAnthony_PTS = [2122,1881,1978,1504,1943,1970,1245,1920,2112,966]
DwightHoward_PTS = [1292,1443,1695,1624,1503,1784,1113,1296,1297,646]
ChrisBosh_PTS = [1572,1561,1496,1746,1678,1438,1025,1232,1281,928]
ChrisPaul_PTS = [1258,1104,1684,1781,841,1268,1189,1186,1185,1564]
KevinDurant_PTS = [903,903,1624,1871,2472,2161,1850,2280,2593,686]
DerrickRose_PTS = [597,597,597,1361,1619,2026,852,0,159,904]
DwayneWade_PTS = [2040,1397,1254,2386,2045,1941,1082,1463,1028,1331]
#Matrix
Points = np.array([KobeBryant_PTS, JoeJohnson_PTS, LeBronJames_PTS, CarmeloAnthony_PTS, DwightHoward_PTS, ChrisBosh_PTS, ChrisPaul_PTS, KevinDurant_PTS, DerrickRose_PTS, DwayneWade_PTS])
del(KobeBryant_PTS, JoeJohnson_PTS, LeBronJames_PTS, CarmeloAnthony_PTS, DwightHoward_PTS, ChrisBosh_PTS, ChrisPaul_PTS, KevinDurant_PTS, DerrickRose_PTS, DwayneWade_PTS)
#%%
#Field Goal Attempts
KobeBryant_FGA = [2173,1757,1690,1712,1569,1639,1336,1595,73,713]
JoeJohnson_FGA = [1395,1139,1497,1420,1386,1161,931,1052,1018,1025]
LeBronJames_FGA = [1823,1621,1642,1613,1528,1485,1169,1354,1353,1279]
CarmeloAnthony_FGA = [1572,1453,1481,1207,1502,1503,1025,1489,1643,806]
DwightHoward_FGA = [881,873,974,979,834,1044,726,813,800,423]
ChrisBosh_FGA = [1087,1094,1027,1263,1158,1056,807,907,953,745]
ChrisPaul_FGA = [947,871,1291,1255,637,928,890,856,870,1170]
KevinDurant_FGA = [647,647,1366,1390,1668,1538,1297,1433,1688,467]
DerrickRose_FGA = [436,436,436,1208,1373,1597,695,0,164,835]
DwayneWade_FGA = [1413,962,937,1739,1511,1384,837,1093,761,1084]
#Matrix
FieldGoalAttempts = np.array([KobeBryant_FGA, JoeJohnson_FGA, LeBronJames_FGA, CarmeloAnthony_FGA, DwightHoward_FGA, ChrisBosh_FGA, ChrisPaul_FGA, KevinDurant_FGA, DerrickRose_FGA, DwayneWade_FGA])
del(KobeBryant_FGA, JoeJohnson_FGA, LeBronJames_FGA, CarmeloAnthony_FGA, DwightHoward_FGA, ChrisBosh_FGA, ChrisPaul_FGA, KevinDurant_FGA, DerrickRose_FGA, DwayneWade_FGA)
#%%
#analise the pattern on Players style excluding free throws
myplot1((Points-FreeThrows)/FieldGoalAttempts)
No handles with labels found to put in legend.


[[696 667 623 483 439 483 381 525  18 196]
 [261 235 316 299 220 195 158 132 159 141]
 [601 489 549 594 593 503 387 403 439 375]
 [573 459 464 371 508 507 295 425 459 189]
 [356 390 529 504 483 546 281 355 349 143]
 [474 463 472 504 470 384 229 241 223 179]
 [394 292 332 455 161 337 260 286 295 289]
 [209 209 391 452 756 594 431 679 703 146]
 [146 146 146 197 259 476 194   0  27 152]
 [629 432 354 590 534 494 235 308 189 284]]
[[819 768 742 564 541 583 451 626  21 241]
 [330 314 379 362 269 243 186 161 195 176]
 [814 701 771 762 773 663 502 535 585 528]
 [709 568 590 468 612 605 367 512 541 237]
 [598 666 897 849 816 916 572 721 638 271]
 [581 590 559 617 590 471 279 302 272 232]
 [465 357 390 524 190 384 302 323 345 321]
 [256 256 448 524 840 675 501 750 805 171]
 [205 205 205 250 338 555 239   0  32 187]
 [803 535 467 771 702 652 297 425 258 370]]
```